Monitoring and Support · A Panta Rhei service by Kramer
Find the fault
before the meeting.
The Site Agent watches every device on the site, continuously. The service raises the alert, clears it when the fault clears, forwards it wherever your team already works, and turns it into an incident someone owns — with Kramer support one assignment away.
The whole estate,
at a glance.
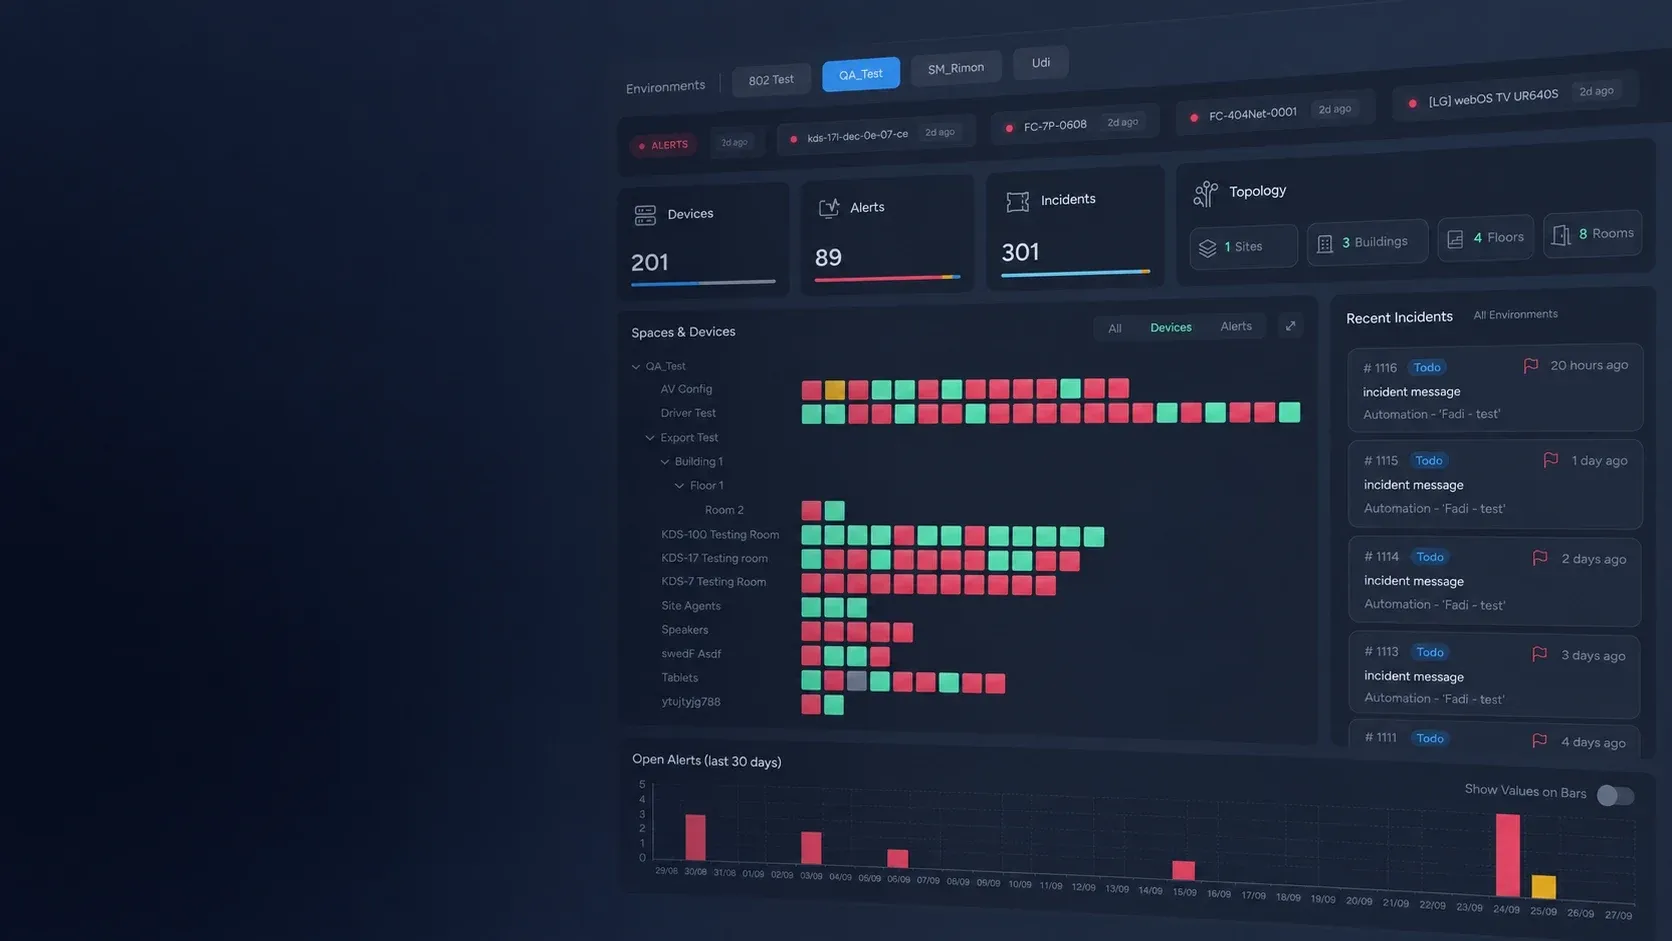
Before a single alert is read, the dashboard above already shows where the trouble is. Here is how to read it.
- HealthyAnswering, nothing open against it
- WarningAn alert open, short of critical
- AlertingA critical alert open
- UnknownNot answering
- One square per device
The Spaces and Devices panel draws the estate as it is, room by room. A red square in a row of green is one fault; a row of gray is a room that has gone dark.
- Counts at the top
Devices, alerts and incidents totaled for the environment, with the topology beside them: sites, buildings, floors, rooms.
- The last thirty days
Recent incidents with their status and age, and a bar per day of open alerts, so a bad week looks like one.
Watched on site.
Raised in the cloud.
Alert Settings live in the service and are pushed to every Site Agent as a monitoring policy. The agent watches continuously and reports back. The service holds the alert state, raises and clears alerts itself, and forwards both.
Which sensors, on which devices, at which thresholds — and the drivers that say how to reach them.
Every device's alert status, held here. Raised when a reading crosses the line, cleared when it comes back.
- Microsoft Teams
- Slack
- ServiceNow
- Jira
- Freshdesk
- Incidents
Per device, per sensor, against the policy it was given. Nothing on site waits for someone to look.
- System
- Protocols
- Kramer devices
- Any device, by driver
An alert that names
a room, not an address.
What the agent sees arrives carrying the context you need to act on it.
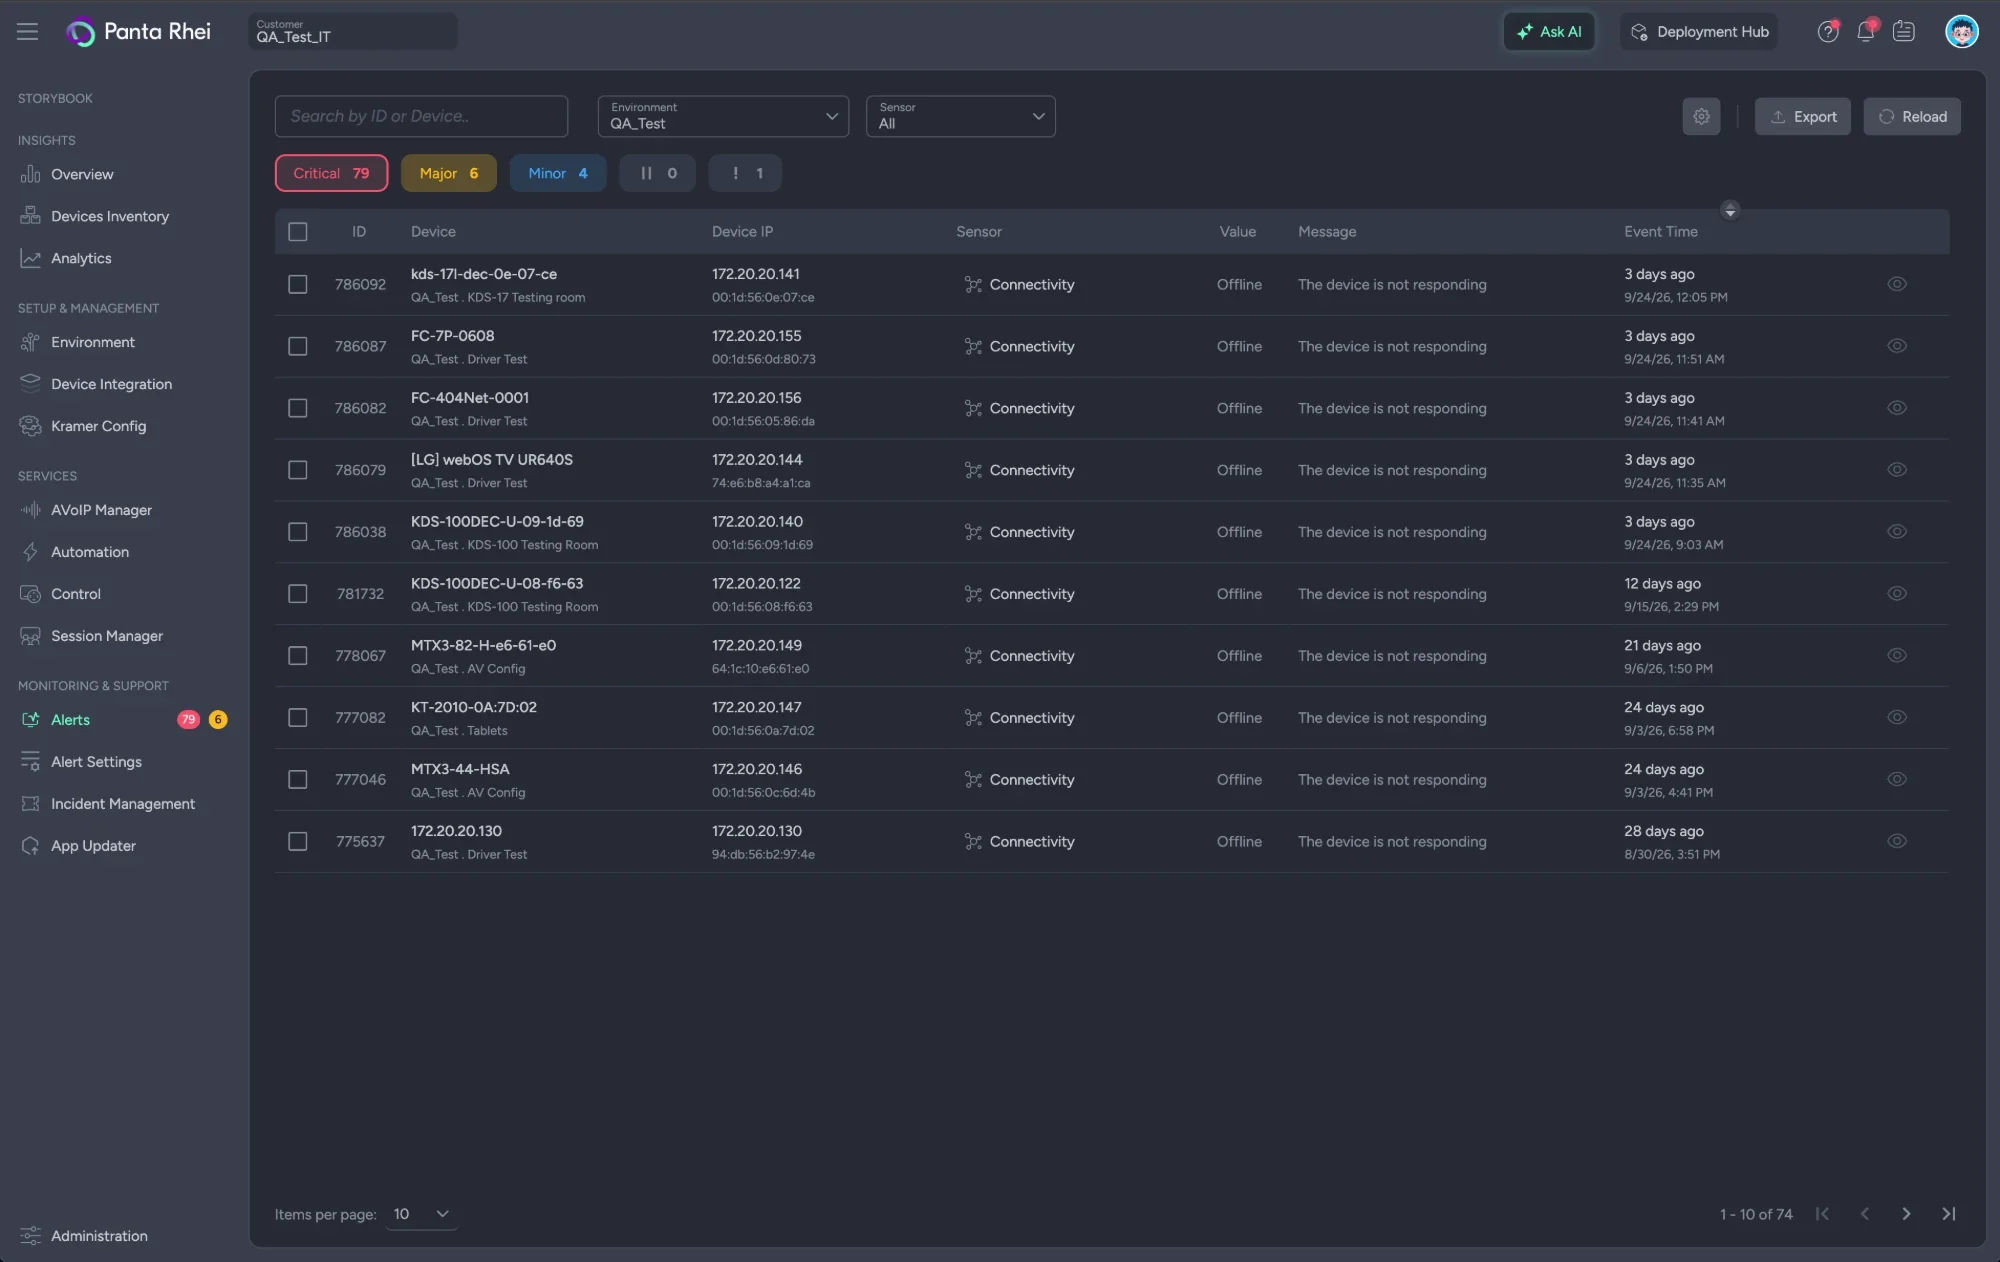
- ✦Three severities, set by you. Critical, major and minor, assigned per sensor. Quick-filter the feed by any of them.
- ✦Named by the room. Environment, space, device, address, the sensor that fired, the value and the message. You know where to walk before you have opened anything.
- ✦A live feed you can hold still. Pause, play and stop, because a list that reorders itself under you is how things get missed.
- ✦Filter, search, export. By environment or sensor, by device or alert ID, and out to Excel — the view, or one device's whole history.
Nobody closes
an alert by hand.
The service holds every device's alert status. It raises the alert, and it clears it.
- ✦Raised when it crosses the line. The service holds each device's alert status and raises the alert itself, from what the agent reports.
- ✦Cleared when it comes back. Nobody closes an alert by hand. When the reading recovers, the alert clears, and the clear is forwarded too.
- ✦The history stays. Every raise and every clear, per device, with the Site Agent that saw it. A flapping device shows as one.
Four kinds of eyes.
Any device.
What the agent watches depends on what the device can say. Four ways of listening, from a ping to a driver you wrote yourself.
- 01
System
Connectivity · Website · Application healthBuilt into the agent. Is the device there, is its web interface up, is its application answering.
- 02
Protocols
PJLink and other generic alert protocolsStandards a device already speaks, read as sensors, so a projector reports the way projectors report.
- 03
Kramer devices
Temperature · Power state · Signal presence · StreamingProprietary and deeper: what Kramer hardware knows about itself, surfaced with nothing to write.
- 04
Any device, by driver
Built-in sensors, or ones you createA driver you build defines how to connect and what to read. Create a custom sensor on it, set thresholds, and any device alerts like the rest.
A projector, read
the way projectors report.
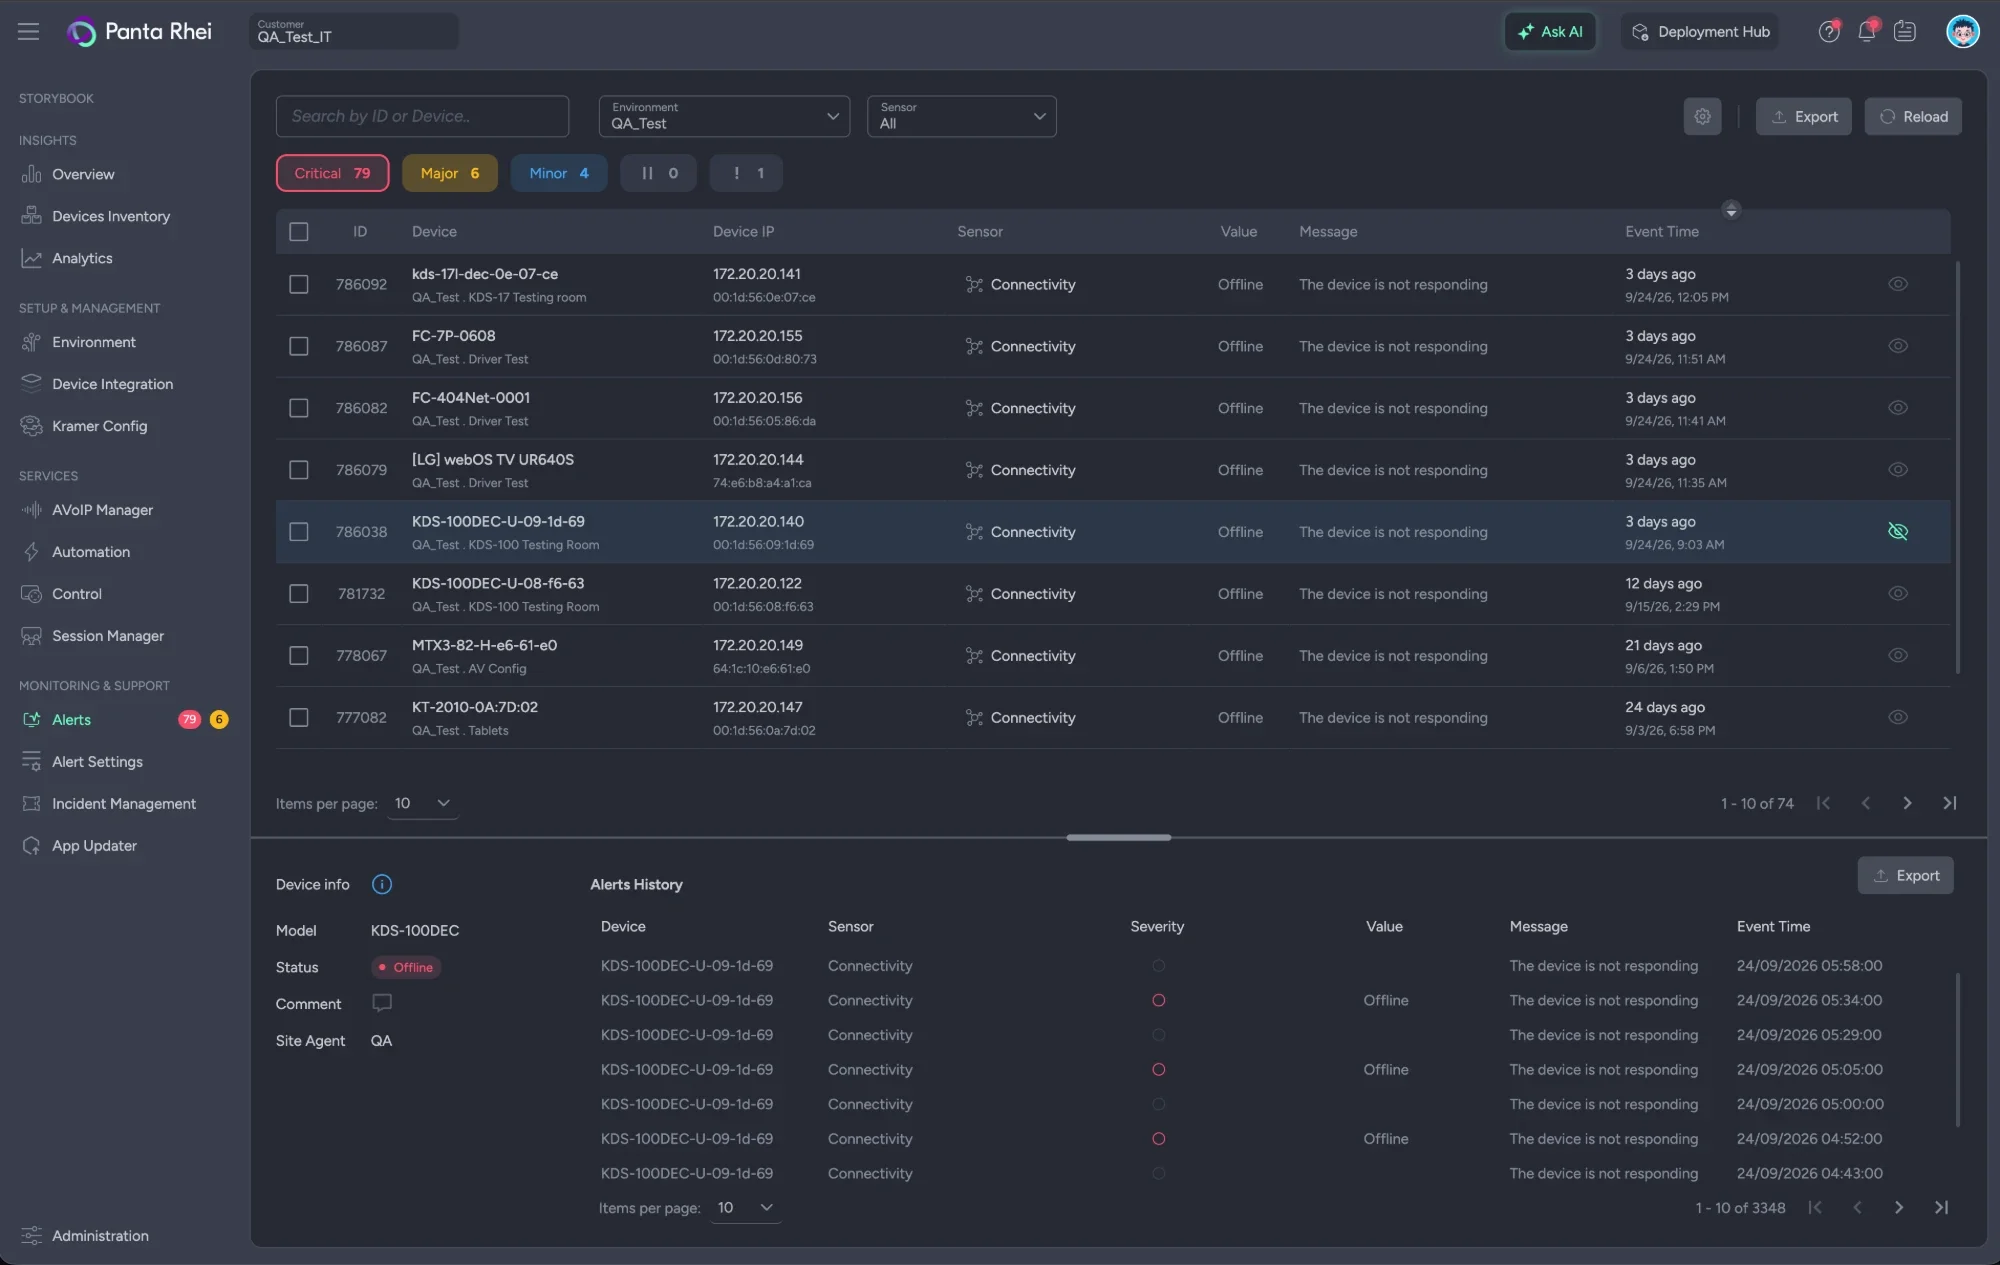
PJLink as the platform sees it: seven measurements, each a switch, each mapped to a severity.
- ✦One protocol, seven measurements. Air filter, cover, fan, issues, lamp, lamp hours and temperature, each switched on or off for the estate.
- ✦Warning and error, mapped. A PJLink warning raises a major alert, an error a critical one. The projector reports the way projectors report; the platform decides what that means.
- ✦Numbers where there are numbers. Lamp hours carry their own minor, major and critical bands, overridable from the defaults.
You decide what
counts as unwell.
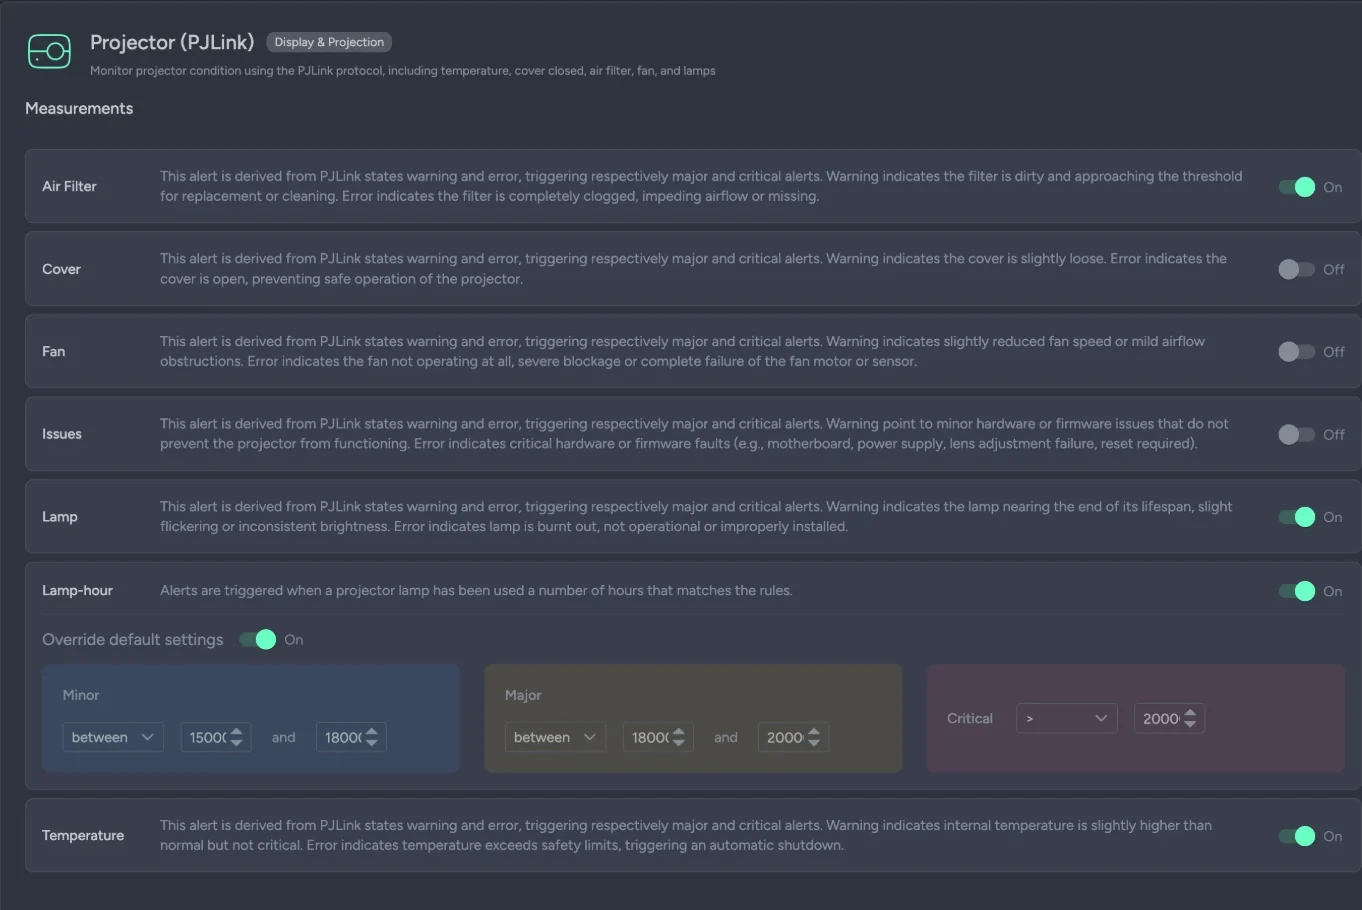
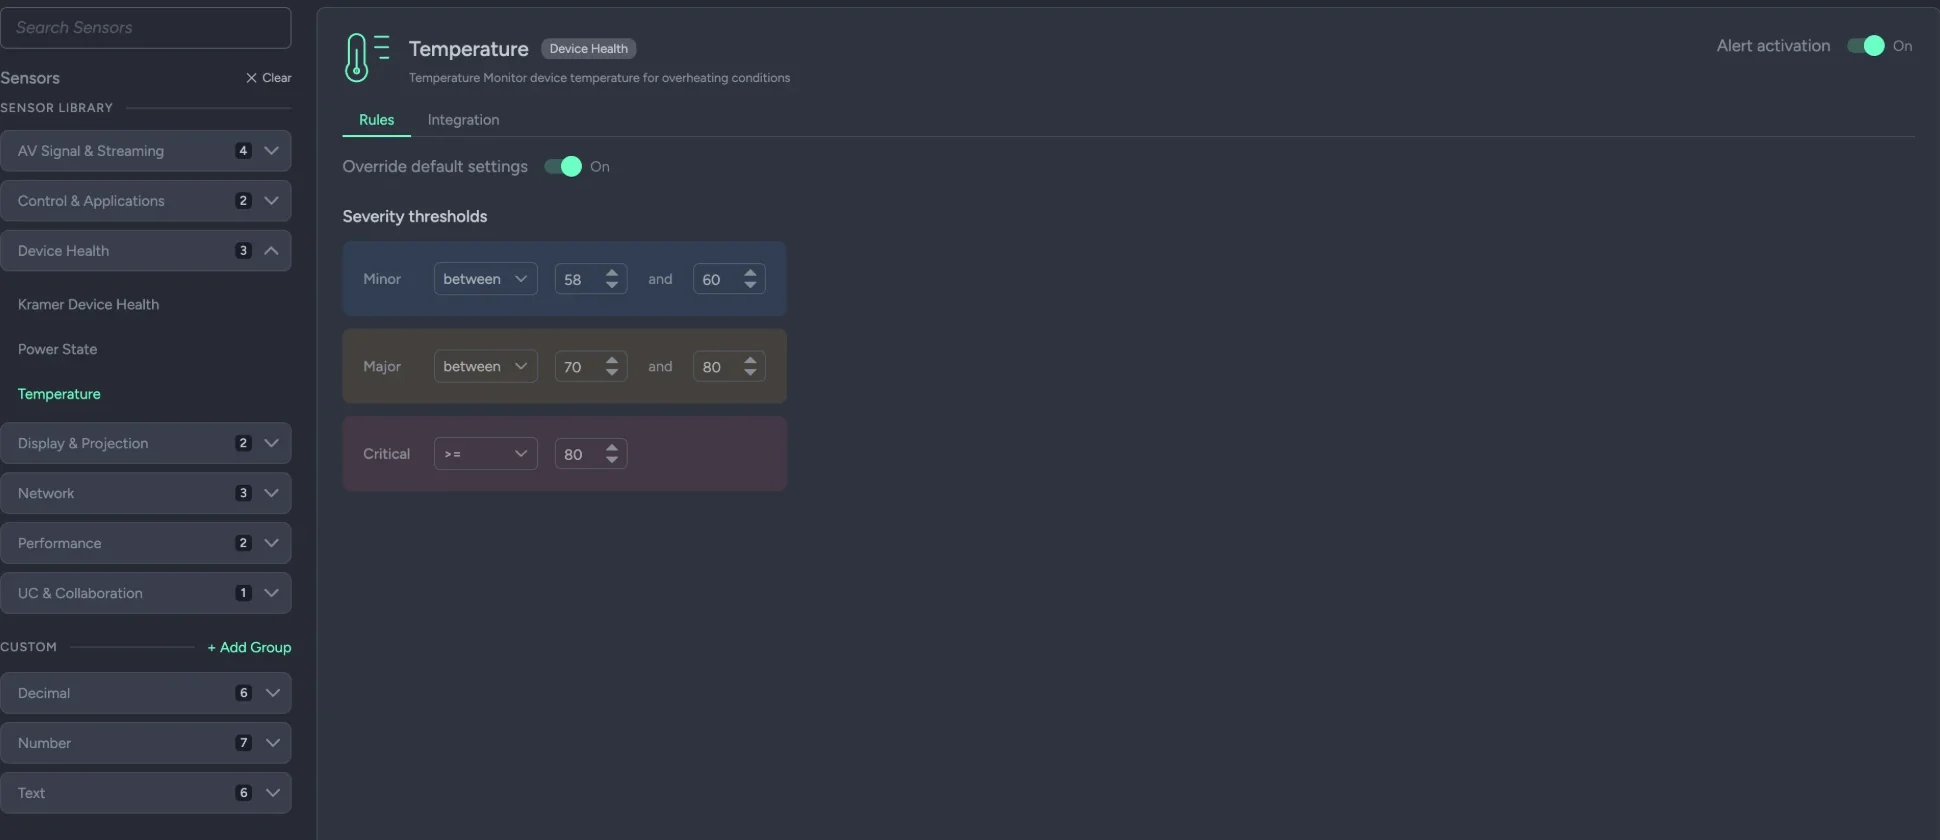
Every sensor carries its own bands. A temperature that is normal in a rack is not normal in a lectern.
- ✦A library, by category. Built-in sensors grouped as the product groups them, with a count in each. Pick one, switch it on.
- ✦Three bands, yours to set. Minor between this and that, major between that and the next, critical at or above. Override the defaults per sensor.
- ✦Activated, or not evaluated. Alert activation is a switch on the sensor. Off means it is never read.
Built in, or built
by you.
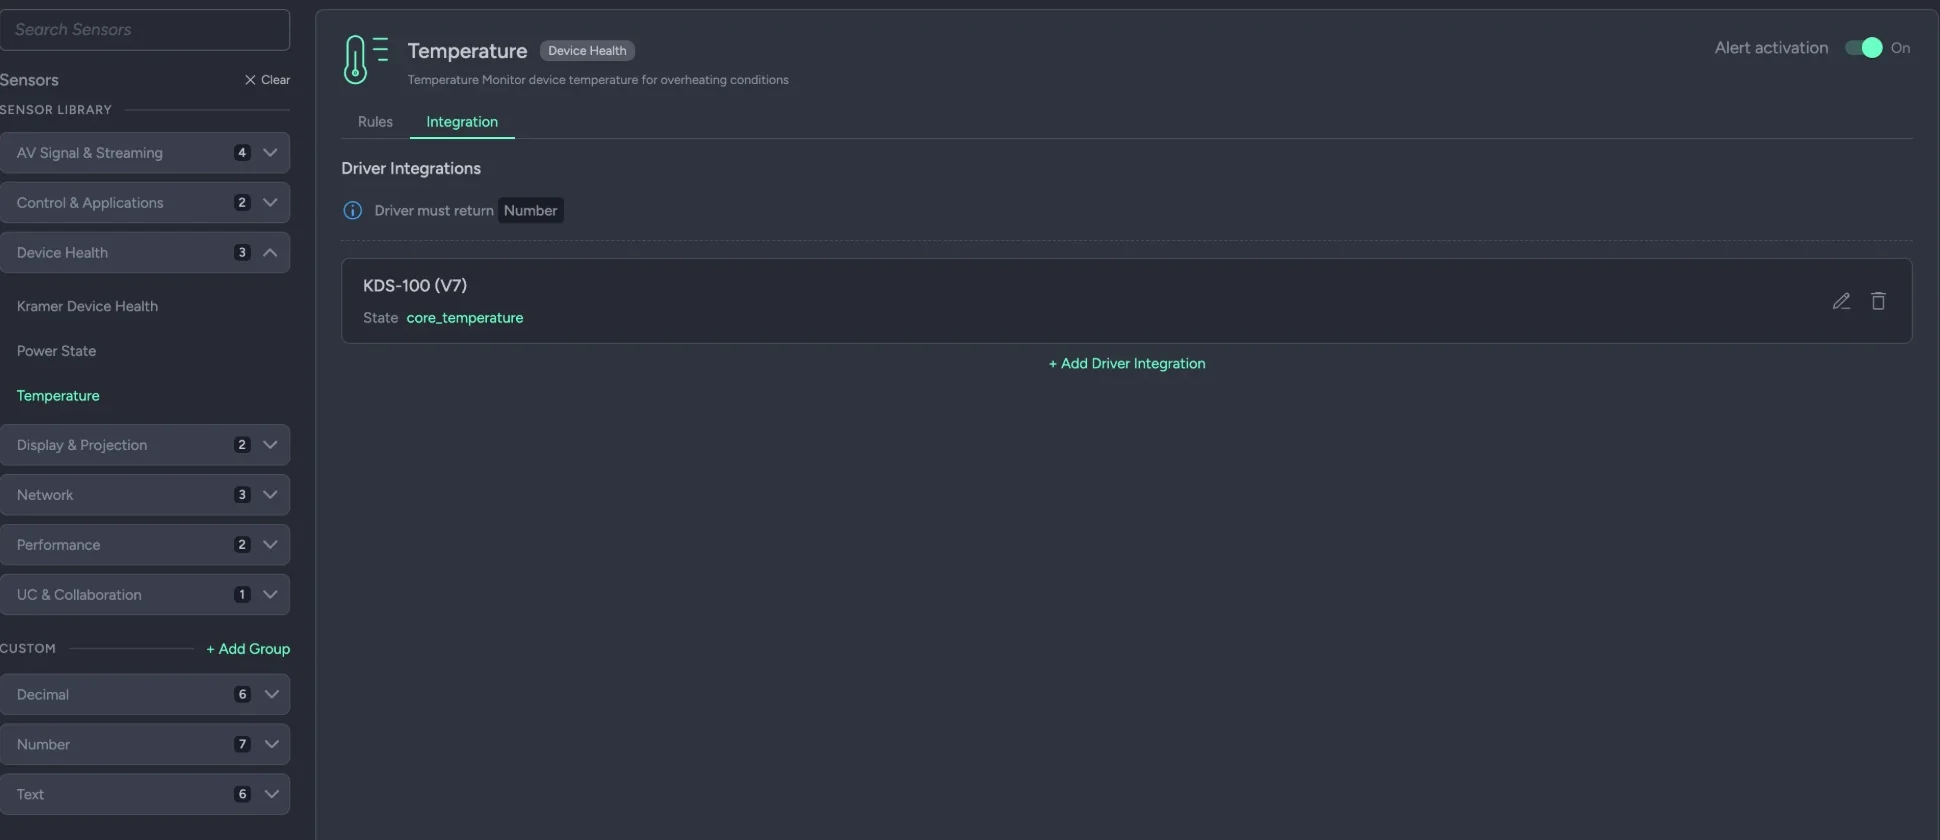
A sensor is not hard-wired to a product. It reads a state from a driver, and the driver can be yours.
- ✦A sensor reads a driver state. The Integration tab binds the sensor to a state a driver exposes — here a KDS-100's core temperature — and says what the driver must return.
- ✦Your own sensors, on your own drivers. Custom groups — decimal, number, text — hold sensors you create yourself, reading states from drivers you built in Panta Rhei. Any device, any measurement.
- ✦Then thresholds, like the rest. A custom sensor gets the same minor, major and critical bands and raises the same alerts.
The part where
something gets fixed.
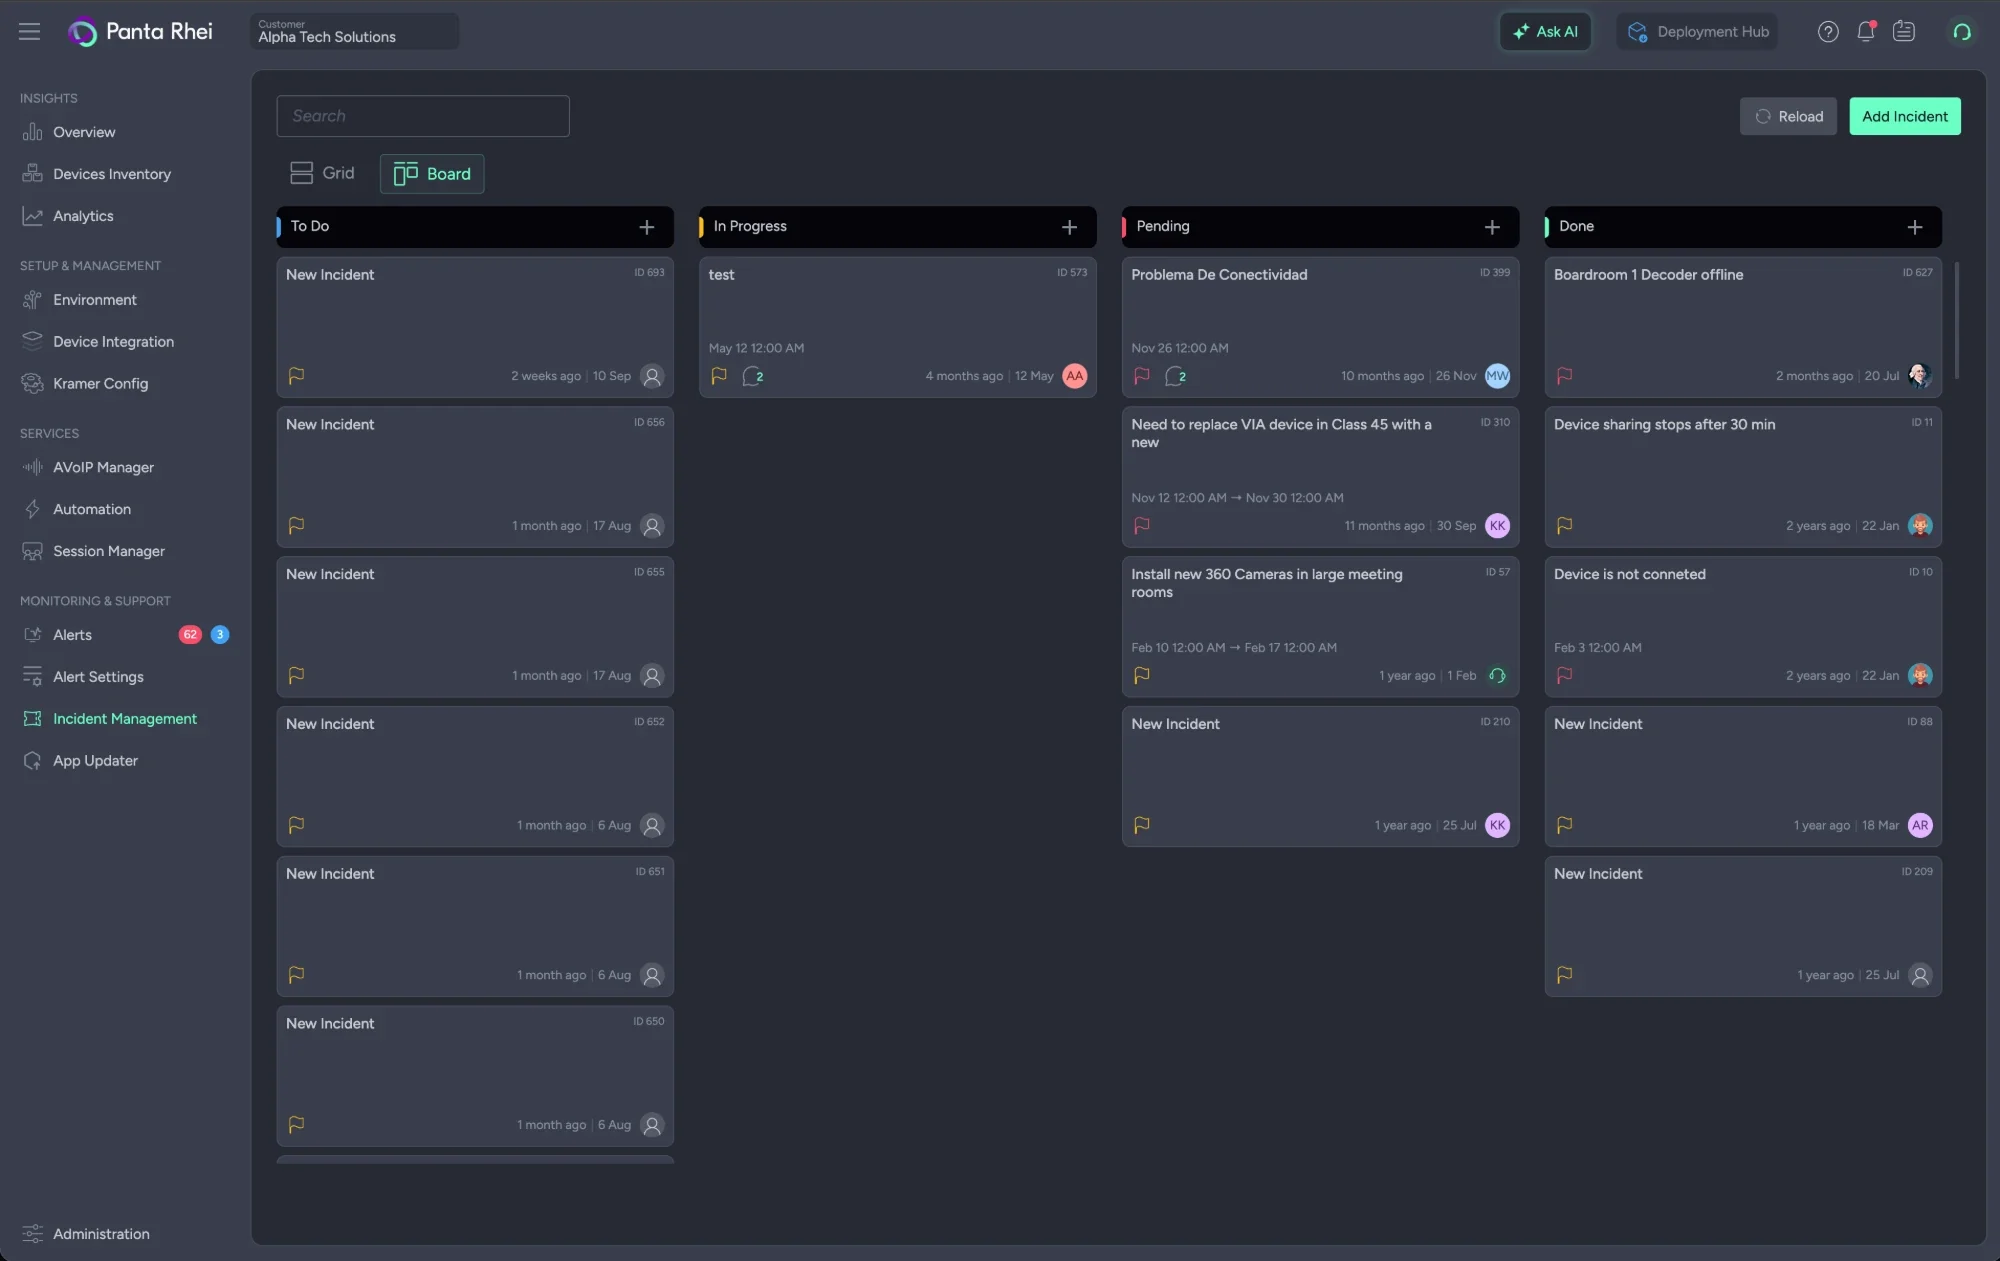
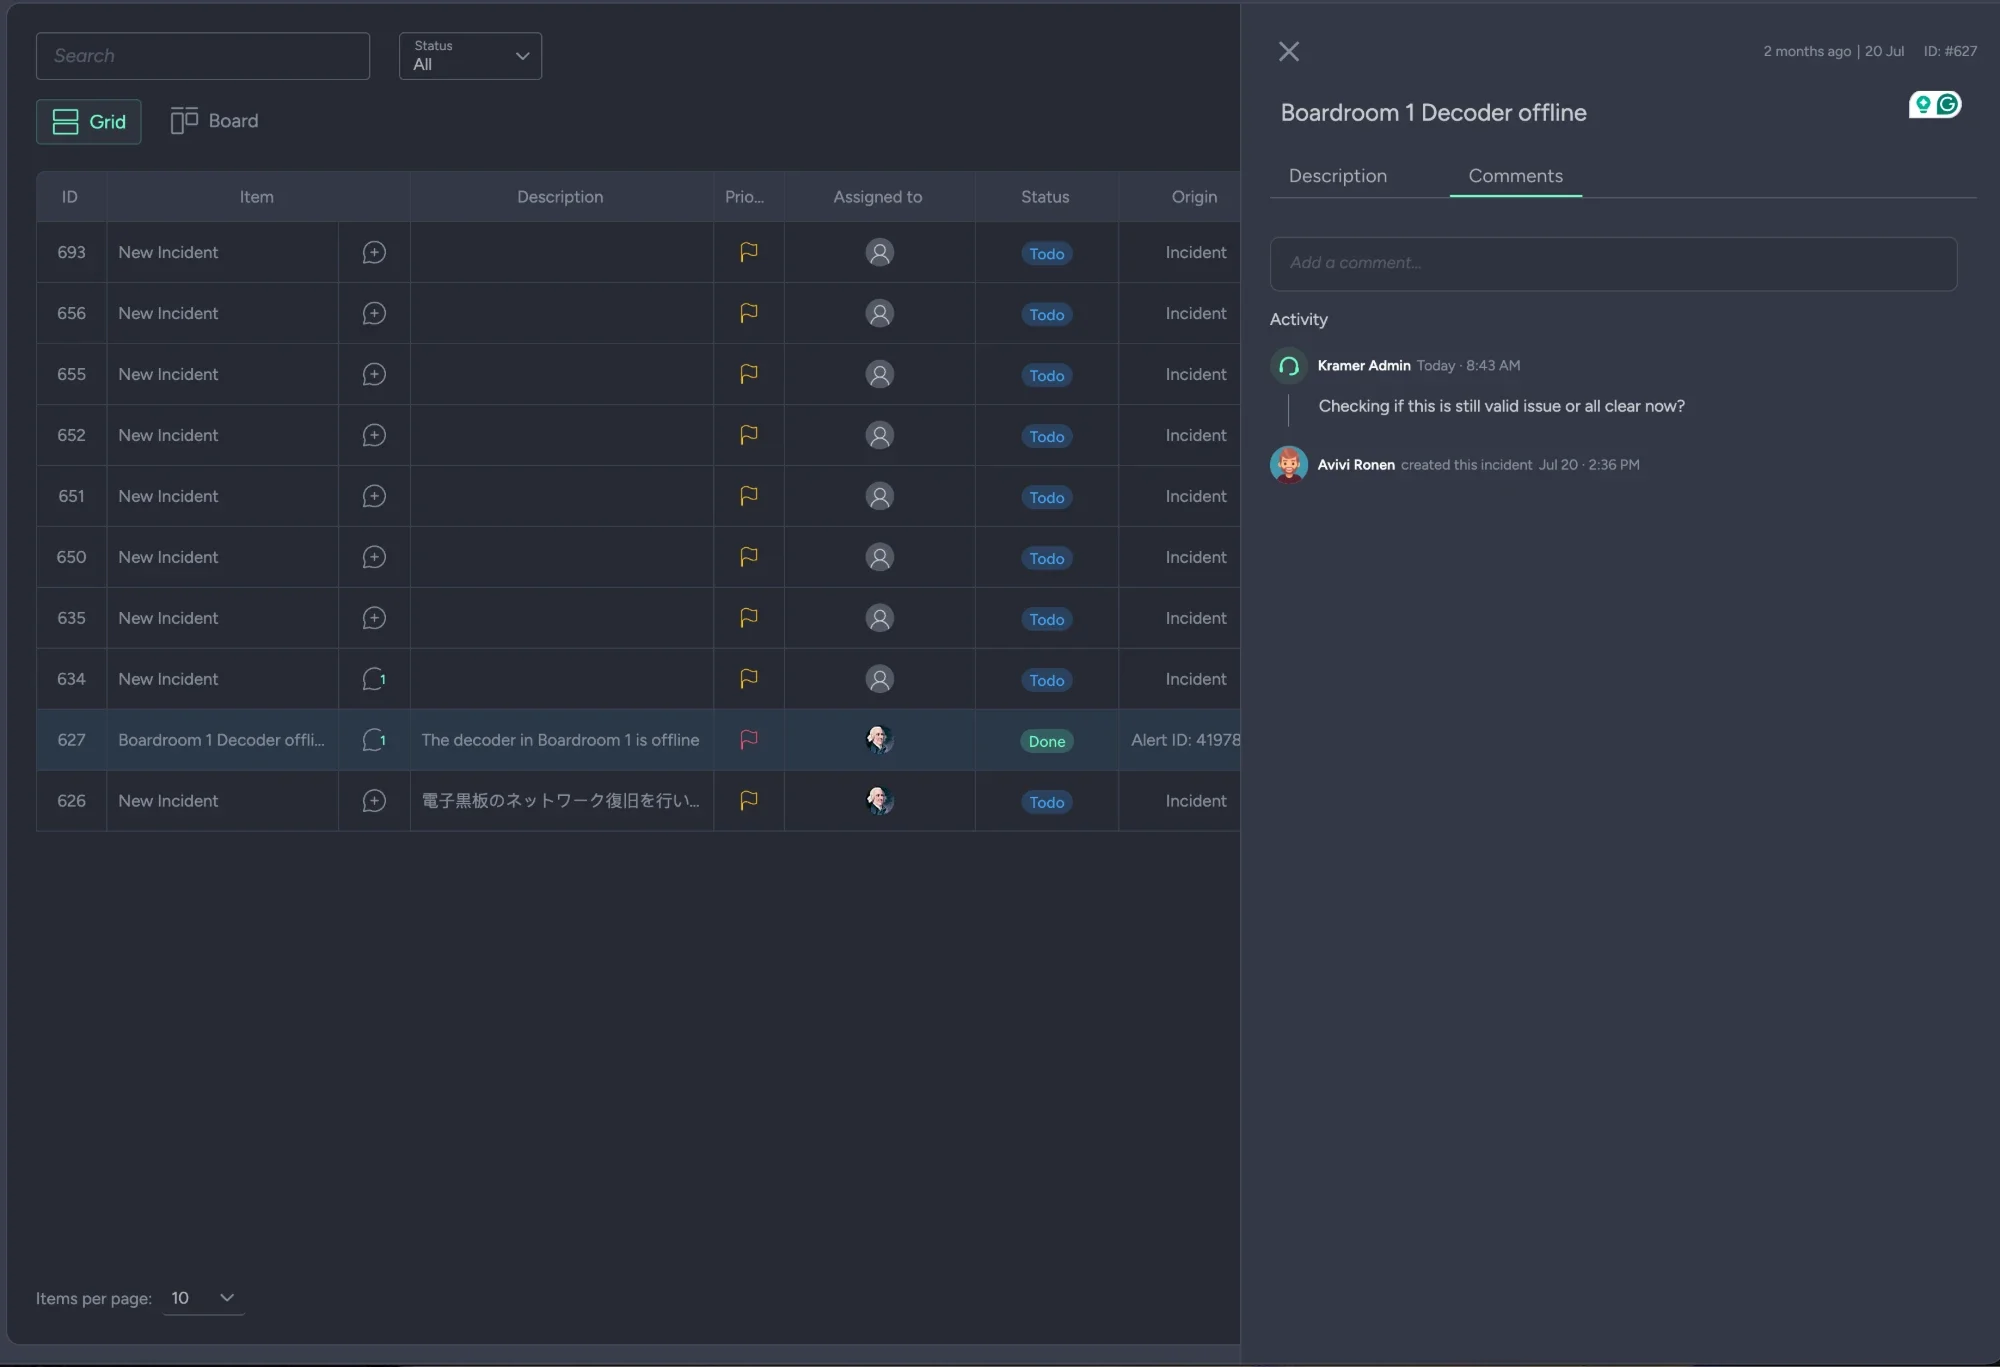
An alert is an observation. An incident is work, and the system that tracks it is inside the platform.
- ✦Built in, not bolted on. A full incident system inside Panta Rhei: To Do, In Progress, Pending, Done — a grid for working a queue, a board for running a standup.
- ✦From an alert, or by hand. An incident opened from an alert keeps the alert ID as its origin. Anything else — a request, a planned replacement — is a card someone adds.
- ✦Work, not observations. An owner, a priority, start and due dates, a description, up to five files, and the conversation, all on the incident.
Everything about it,
on it.
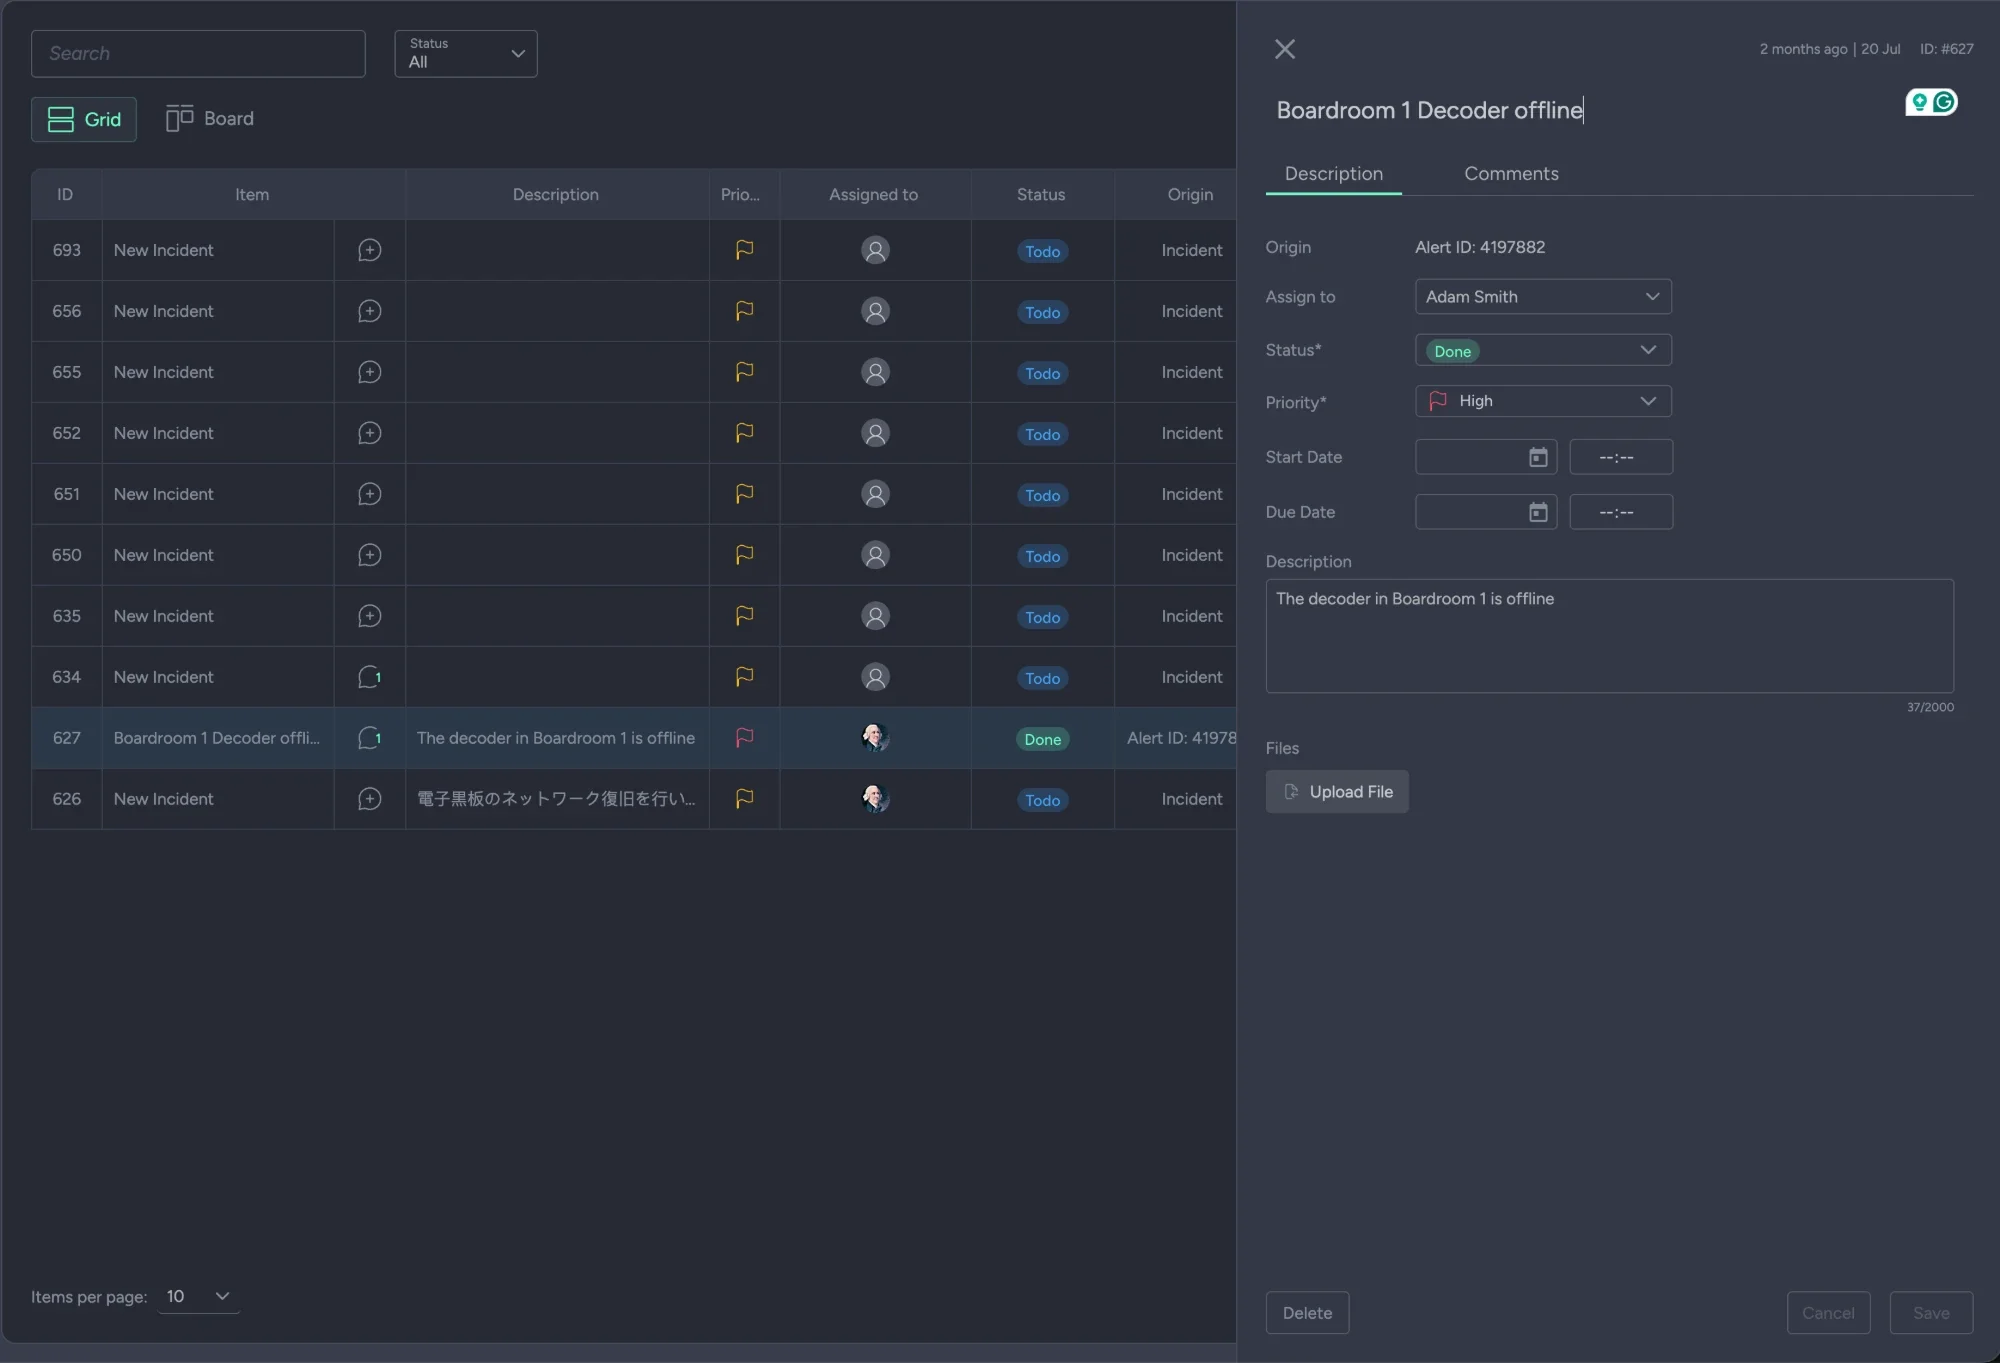
Open one and the cause, the owner, the deadline, the evidence and the conversation are all there.
- ✦Origin. The alert ID that raised it, or the automation script that opened it. The trail back to the cause survives every handover.
- ✦Ownership and dates. Assigned to a person, with a priority, a start date and a due date — the things that decide whether it gets done.
- ✦Evidence and conversation. Files attached to the incident, and comments that keep the reasoning with the ticket rather than in someone's inbox.
Out to where your team
already works.
Very few organizations want another inbox. Alerts and incidents are forwarded when raised and again when cleared, to the tools you already run.
- Microsoft TeamsWebhook — alerts and incidents, each to its own channel
- SlackWebhook — configured the same way as Teams
- EmailRecipient lists for alerts and for incidents
- ServiceNowIncidents created as ticketsOne-way
- JiraIncidents created as issues in a project
- FreshdeskIncidents created as ticketsOne-way
One-way means Panta Rhei opens the ticket and does not read status changes back. Alerts are forwarded when raised and again when cleared, so a channel sees the recovery, not only the fault.
And when it is
Kramer's to fix.
Support is not a separate phone number. It is an assignee on the same incident.
- ✦Open an incident to Kramer. With a Monitoring subscription, an incident assigned to Customer Support goes to the Kramer support team — for anything about your deployment or environment.
- ✦Same incident, same thread. It stays the ticket you opened, with its origin, its files and its comments. Kramer works in the thread, not in a separate case you have to keep in step.
- ✦Assessed and followed through. The team assesses the issue and follows up until it is resolved.
Fix the class of fault,
not the instance.
Some of what monitoring surfaces is a known bug with a version number. Updating the fleet is part of support.
- ✦Scheduled into the maintenance window. Now, or in the window set on the environment, so firmware lands when the rooms are empty.
- ✦Versions across the fleet. Current against available, per device and per type, with every upgrade's outcome recorded.
- ✦Kramer devices only. Everything else is discovered, inventoried, monitored and alerted on. Updating is where the line is.
Why the maintenance window matters
A device is unresponsive while it upgrades, and may restart. Scheduling into the window set on the environment keeps that from happening at 09:55 — and offline devices are skipped, so a site that was dark does not silently miss the update.
The questions IT actually asks.
Where does the monitoring actually run?
On the Site Agent, on your site. Alert Settings are configured in the service and pushed to every agent as a monitoring policy; the agent watches each activated device and sensor continuously and reports back. The service holds the alert state and raises or clears alerts from what it is told.
Do we have to close alerts ourselves?
No. An alert is raised when a reading crosses its threshold and cleared automatically when it recovers. Both the raise and the clear are forwarded to whatever you have connected, and both stay in the device's history.
What can it monitor on equipment we did not buy from Kramer?
System sensors — connectivity, website, application health — work on anything IP. Generic protocols such as PJLink are read as sensors. Beyond that, a driver, pre-built or written by you, defines how to connect to a device and what to read, and you set thresholds on it like any other sensor.
Can we decide what counts as critical?
Yes, per sensor. Each one is activated per device and carries its own severity bands for minor, major and critical. A sensor you leave off is never evaluated.
Will it sync with our ITSM?
Alerts and incidents go to Microsoft Teams, Slack and email; incidents are created in ServiceNow, Jira and Freshdesk. ServiceNow and Freshdesk are one-way: the ticket is opened, but status changes made there are not read back.
Is the incident system a real one, or a list of alerts?
A real one, built into the platform: incidents with an owner, priority, dates, files and comments, moving through To Do, In Progress, Pending and Done on a grid or a Kanban board. An incident keeps the alert that raised it as its origin, and can also be opened by an automation script or by a person.
What if we cannot fix it ourselves?
With a Monitoring subscription, assign the incident to Customer Support and the Kramer support team picks it up, in the same thread, and follows it through to resolution.
Find out what your estate has been hiding.
The first week of monitoring an estate that has never been monitored is usually the interesting one. Bring a site and we will show you what it has been failing at quietly.
Nothing to monitor until it is found — see what any device can report.